
End-to-end pharmacokinetics services encompasses study strategy and design, data workflow management, analysis, and reporting for the entire nonclinical and clinical study process. Allucent clinical pharmacology, modeling and simulation services ensure the highest standard for you to get the most out of your data, to set your program up for success, and to meet regulatory requirements. We evaluate what influences the drug’s disposition and impacts drug effect and recommend doses to improve therapeutic outcomes.
Study Design, Sampling Strategy, and Analysis Plan
Early clinical studies and clinical pharmacology studies require meticulous planning of the design, objectives, dose, sampling scheme, and analysis plan.
Study Design and Dose
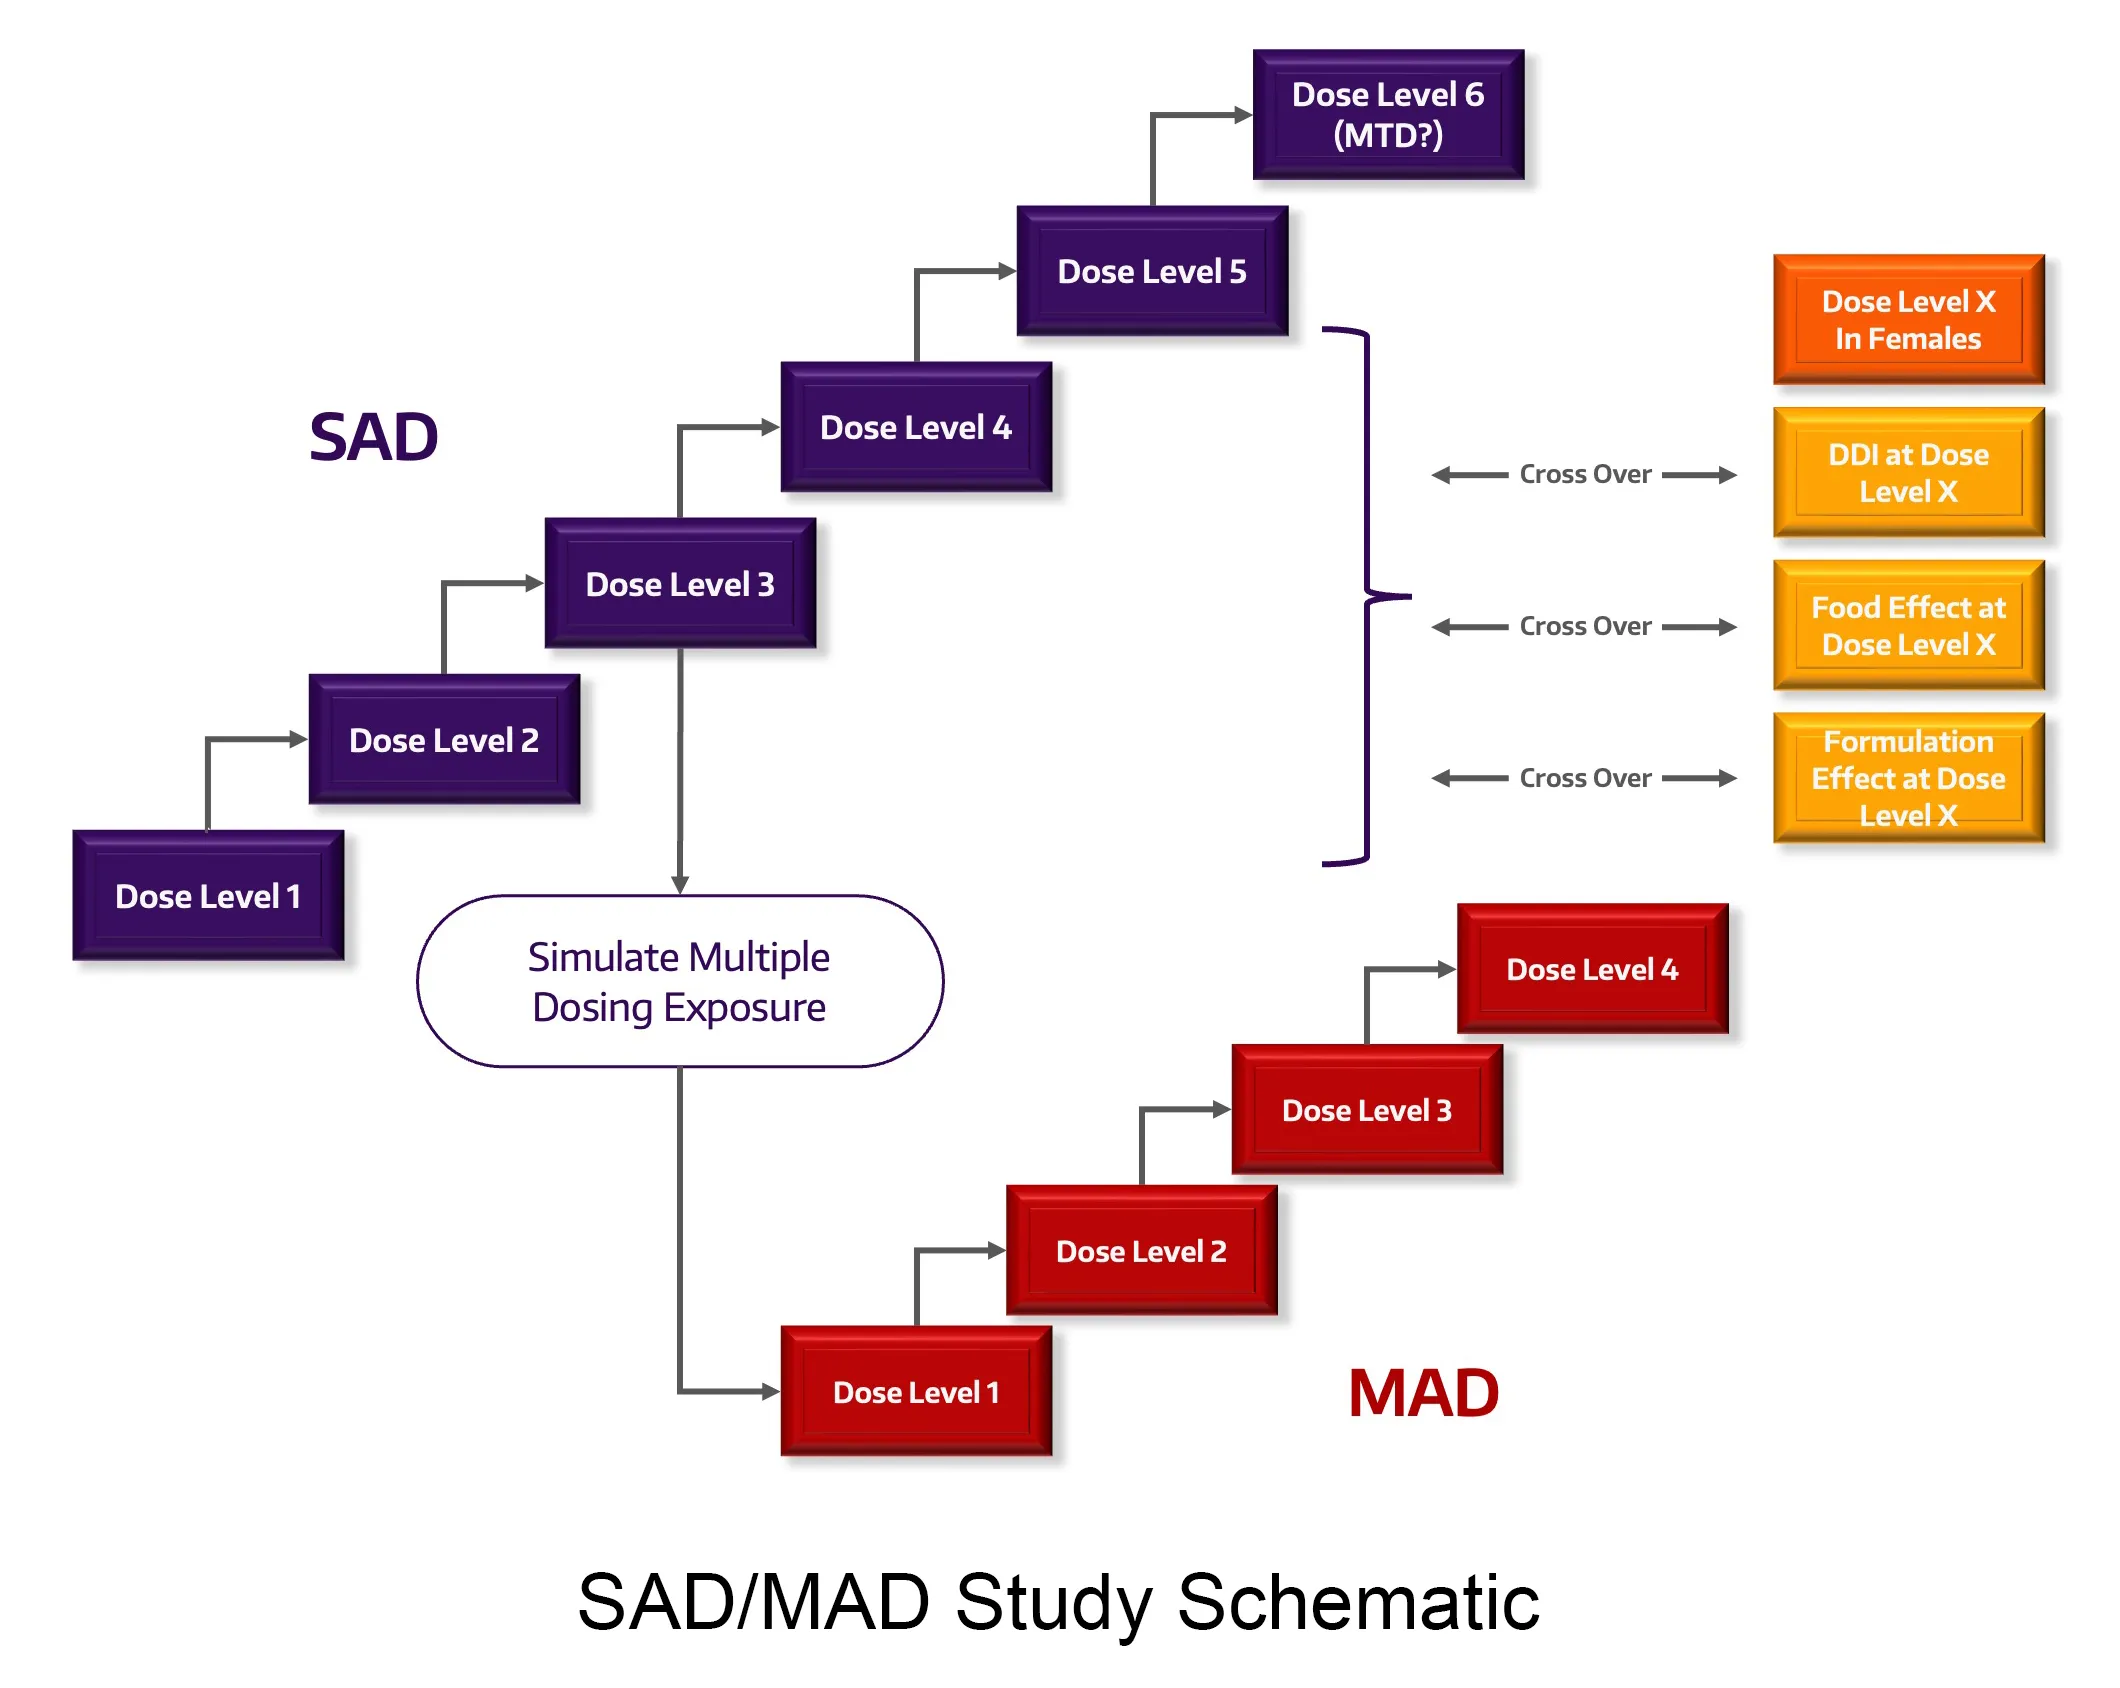
With traditional and non-traditional study design expertise in normal healthy volunteers and patients, we can increase the quality and impact of your studies such as First in Human (FIH), Single and Multiple Ascending Dose (SAD, MAD), proof-of-concept (PoC), drug-drug interactions (DDI), relative and absolute bioavailability/bioequivalence, thorough QT (TQT), food effect (FE), mass balance and specific populations, (pediatric, pregnancy, neonate, hepatic and renal impairment).
PK Sampling
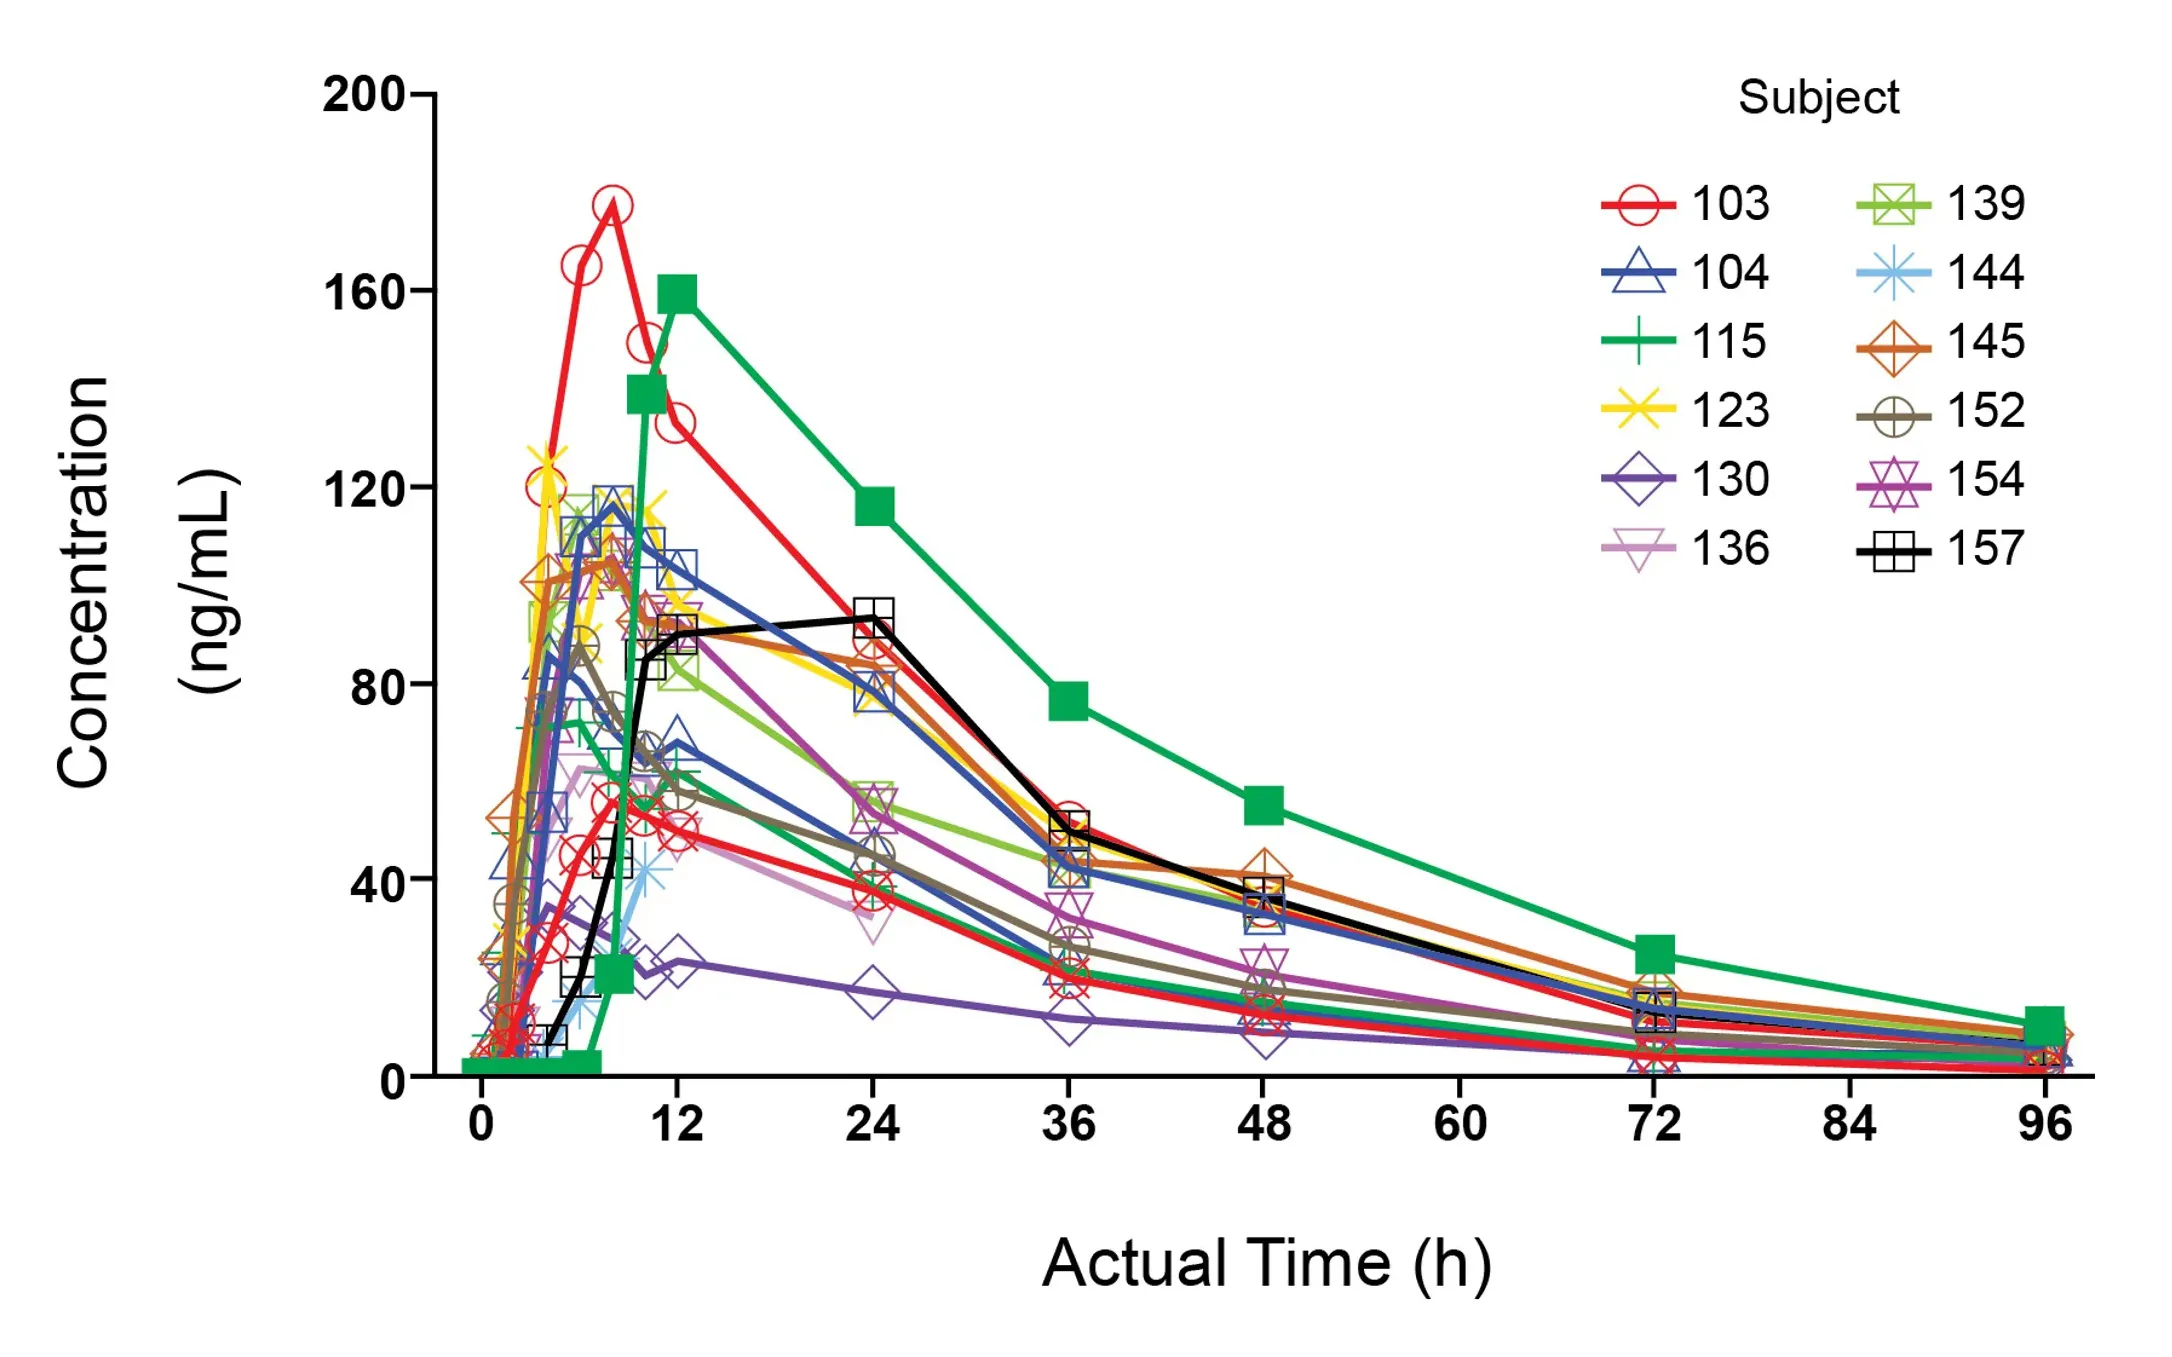
Typically, early development and clinical pharmacology studies require intensive serial blood sampling to understand the entire drug concentration versus time profile, and properly determine PK parameters. We ensure sampling is accurate, efficient, and compliant with regulatory standards. We’re proficient in both clinical and nonclinical sampling and the techniques required for all biological matrices to evaluate PK (blood/plasma/serum, urine, CSF, tissues).
Analysis Plan
Our significant experience writing prospective analysis plans describes how the data collected will be structured and which methods and tools are utilized to analyze the data to deliver reliable results and graphical and tabular displays for reporting.
Seamless Data Workflows and Realtime Analyses
Data Flow
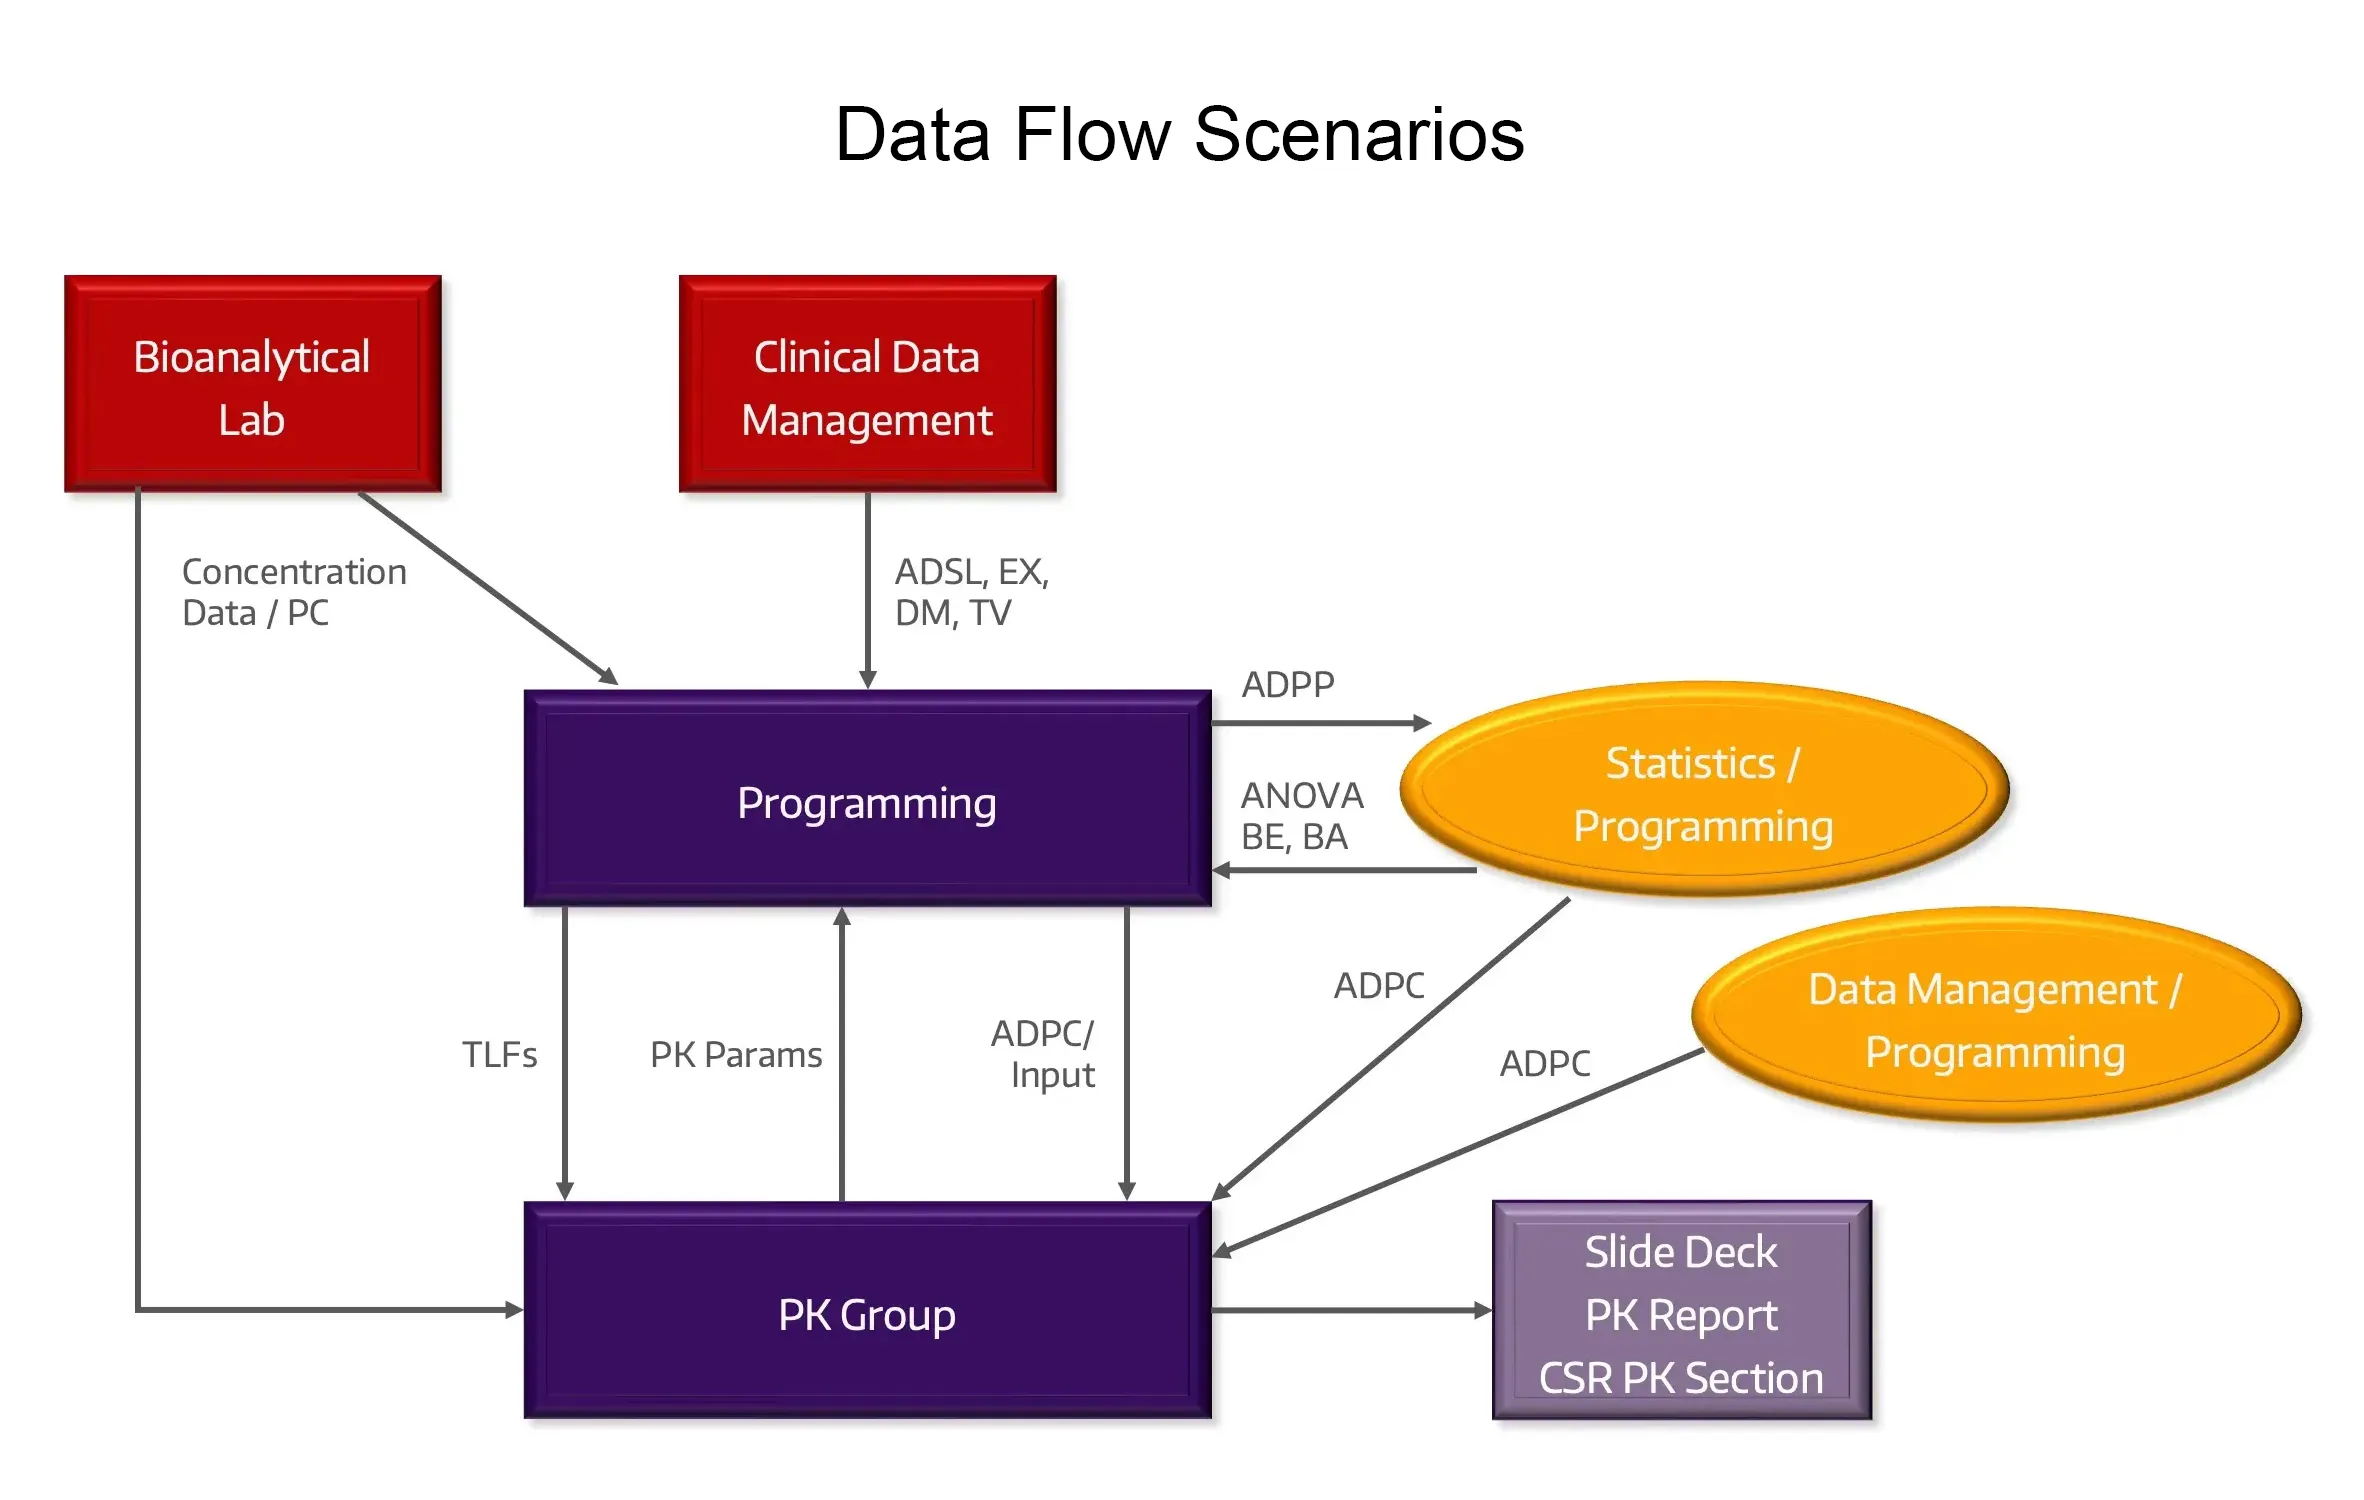
We lead the data workflow from the bioanalytical lab and patient-specific data sources to create analysis-ready datasets for PK and PK/PD endpoints.
Data Transfer Agreements
Utilized to set clear expectations for required data specifications and formats.
Data Queries
Expertise in appropriately managing data anomalies, and data queries/cleaning with partners for generating analysis-ready datasets.
Complex Data
Experienced with large and complex datasets typical with early development and clinical pharmacology studies.
Real-Time and Interim Analyses
Efficient delivery of interim analyses for dose escalation, data visualization, cohort analysis, interim study submissions and clinical and study continuation/modification decisions for Study Teams, Safety Review Committee and Data Safety Monitoring Board meetings.
Study and Submission Datasets
Well-documented SDTM and ADaM analysis-ready datasets and CDISC and SEND submission-ready products.
Clinical PK and Nonclinical TK Interpretation and Reporting
Our scientists hold a deep grasp of PK and TK principles and analysis methodologies, and leverage the latest industry leading PK software.
Clinical PK
Our PK analyses and interpretation spans a variety of modalities (small molecules, platforms and biologics including mAbs, CGT, ADCs, TCE, nanoparticle), all routes of administration (intravenous, oral, intramuscular, subcutaneous, intrathecal, buccal, intranasal, topical, intratumoral), and a broad range of therapeutic areas.
Nonclinical Toxicokinetic (TK)
Deep understanding of TK principles, impressive experience with nonclinical TK studies, significant experience in preparing and submitting regulatory documentation and reports.
Reports and Tables, Listings, and Figures (TLFs)
Allucent provides structured and detailed view of study results via TLFs aligned with the analysis plan to deliver proficient analysis and expertise in interpreting results. We provide sections for an integrated Clinical Study Report (CSR) or a standalone PK report which may be appended to a CSR and provide non-GLP TK reports.
CDISC and SEND
We provide data management services both pre- and post-study. Our biostatistics, data management, and programming teams work expertly with CDISC and SEND data standards, delivering datasets for study and regulatory submissions.