

Case Study
By Payton Woodall (Director, Programming, CPMS)
Background
Concentration-QT (C-QT) analyses are cost-effective alternatives to thorough QT clinical trials that help establish the drug’s risk of prolonging the QT interval. Prior to conducting a C-QT analysis, several assumptions should be reviewed to ensure the validity of the pre-specified regression approach. Dozens of tabular and graphical summaries are therefore necessary to approach such an analysis.
Problem
Several development programs required a QT evaluation on accelerated timelines. While many visuals are required before starting the regression, the same visuals are used from one program to another. Quick plots that adequately present the data allow the analyst to get started on the C-QT analysis itself, but these must be remade after the analysis to be report quality, leading to a faster conclusion but leaving the time to a report unchanged.
Allucent's Automated Exploratory Data Analysis Tools to Quickly Produce Report-Quality Visuals Accelerating Client Timelines
Click to Zoom
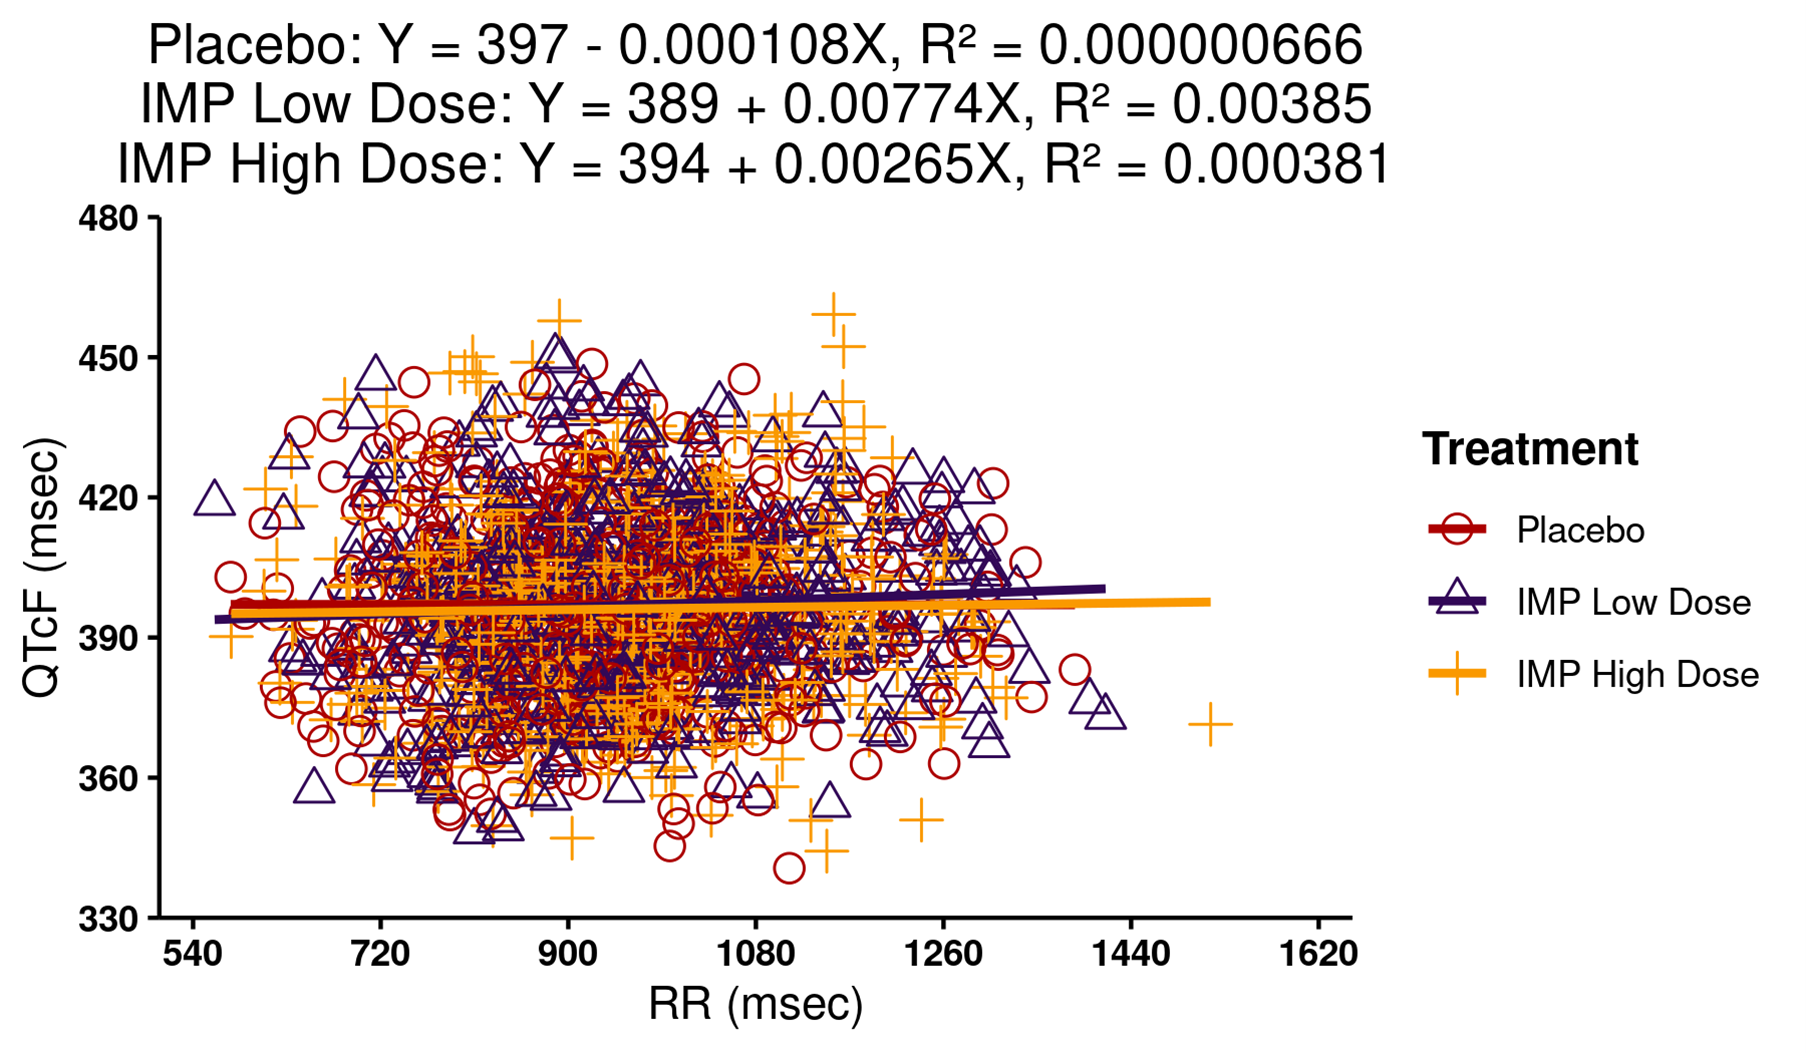
Scatter Plot of QTcF versus RR Intervals with Linear Regressions by Treatment to Confirm QTcF is Independent of Heart Rate
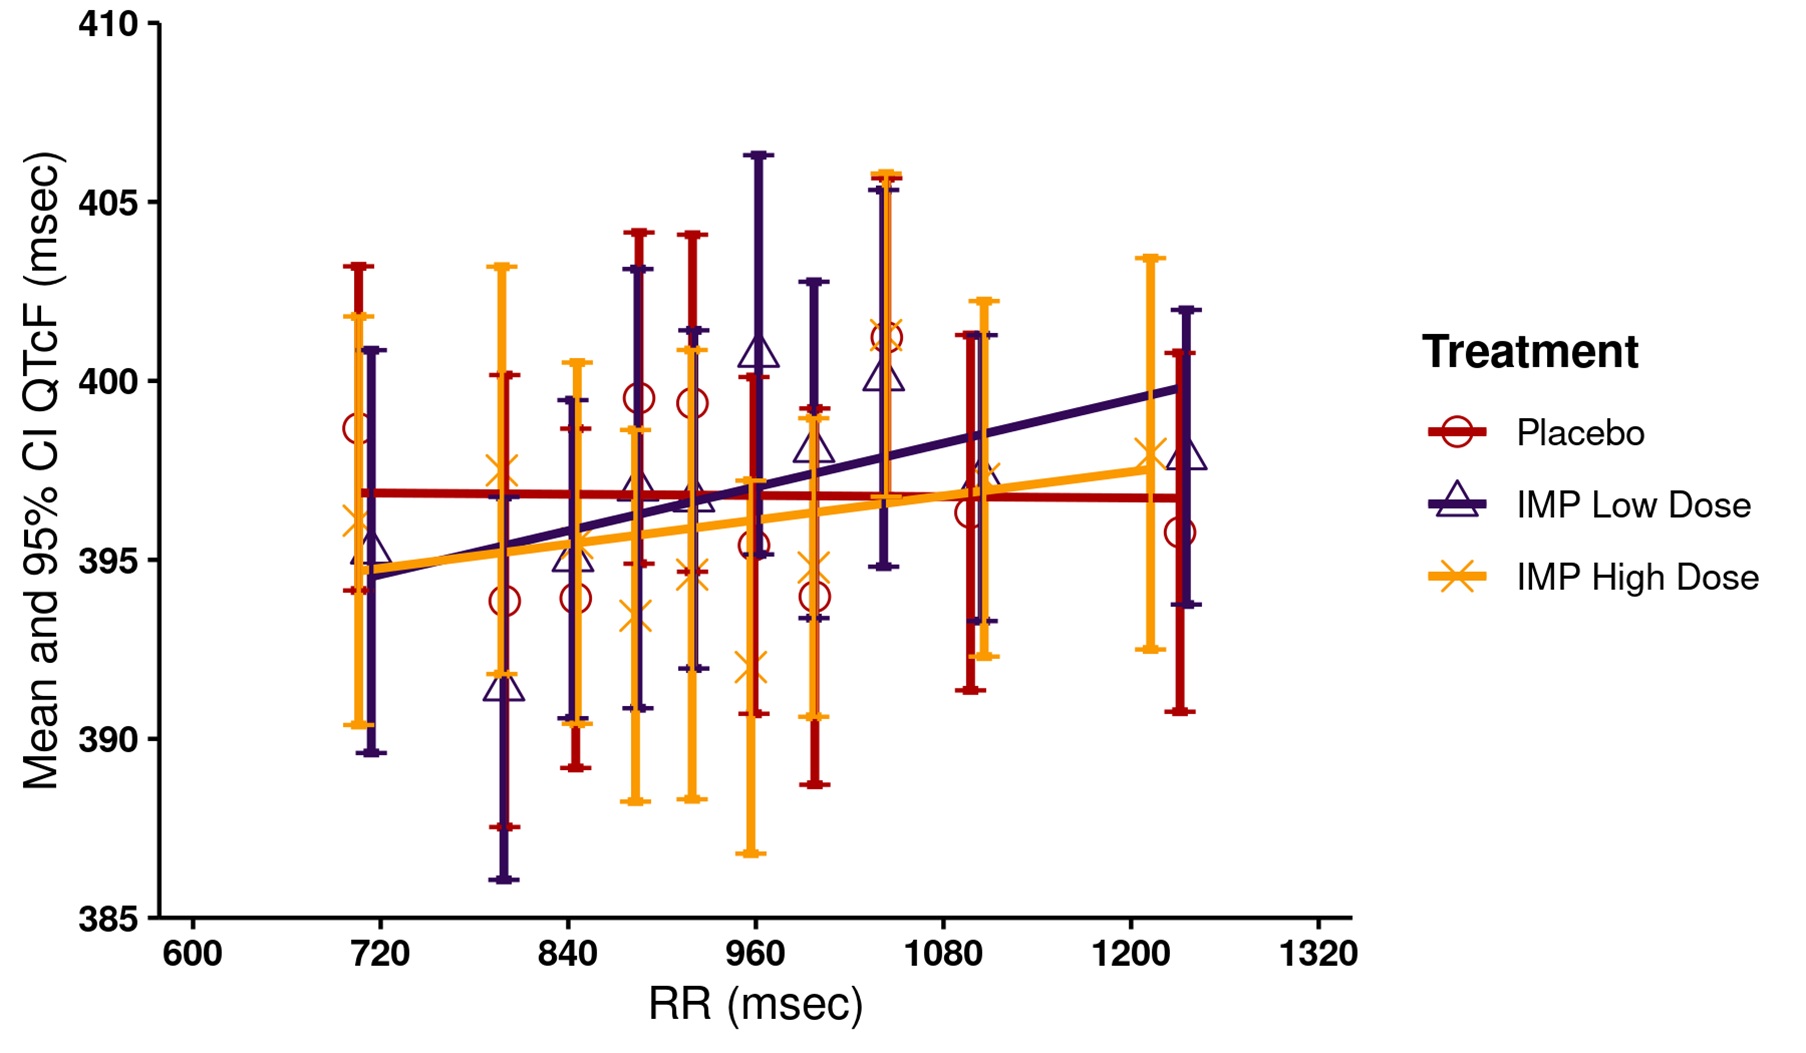
Percentile Plot of Mean QTcF versus RR Intervals by Treatment to Confirm QTcF is Independent of Heart Rate
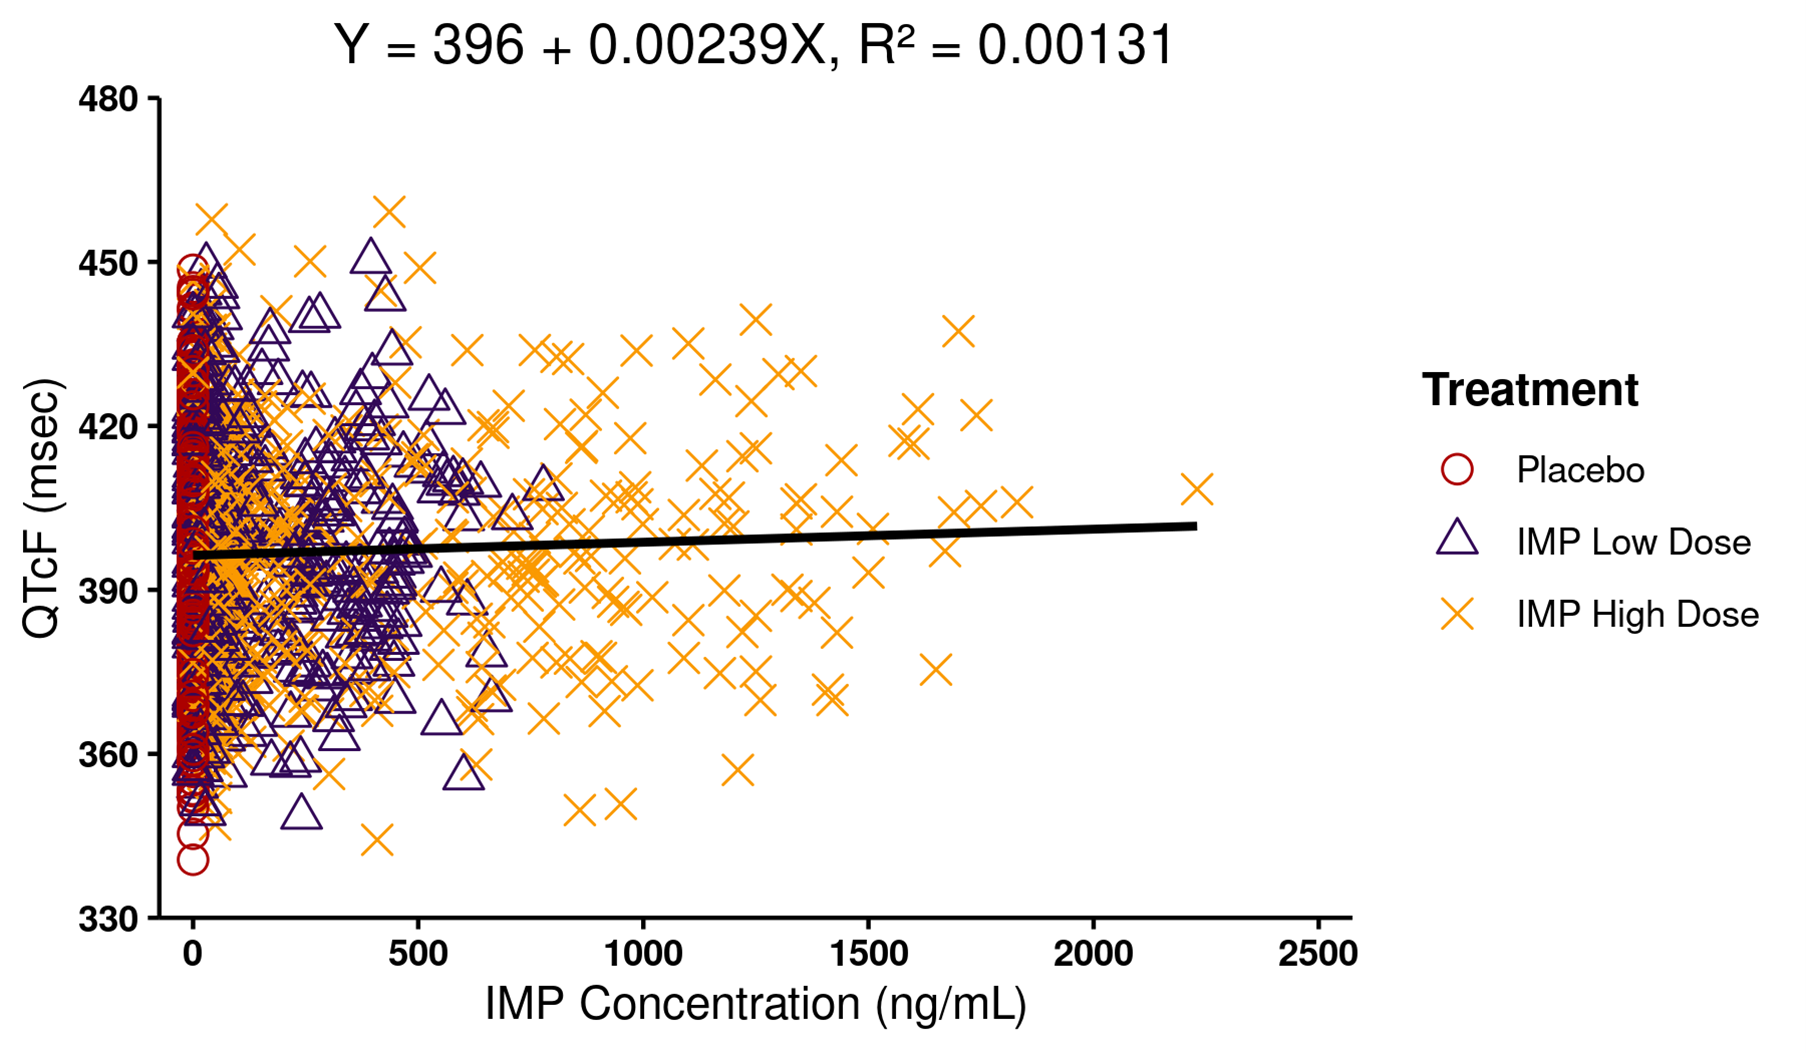
Scatter Plot of QTcF versus IMP Concentrations with Linear Regression to Confirm Concentration QTc Relationship is Linear
Solution
Several easy-to-use functions were developed using R packages from the tidyverse that produce quick and report-quality visuals. Each function produces one or more outputs efficiently, which is especially useful given plots are often interpreted together, like determining hysteresis, and ensures summary methods are consistent across similar visuals. Function inputs can be adjusted for different summary methods and aesthetics, and outputs are ggplot and flextable objects that can further be customized should a specific analysis require it. We used R Markdown and Quarto to generate and report all analyses, plots, and tables into one reproducible document.
Outcome
These functions assist by quickly developing quantitative and visual results to the end-user. Overall, the functions automate much of the exploratory data analysis process and reduce the amount of time needed for assumption verification of the pre-specified C-QT model. Our customers benefit from this effort as it allows us to make well informed decisions earlier and to meet strict timelines.
To learn more about Allucent’s expertise related to C-QT Models, please check out Thorough QT/QTc (TQT) and Complex Concentration-QT Analysis Case Study.